The Relative Error Quantile (REQ) sketch provides extremely high accuracy at a chosen end of the rank domain. This is best illustrated with some rank domain accuracy plots that compare the KLL quantiles sketch to the REQ sketch.
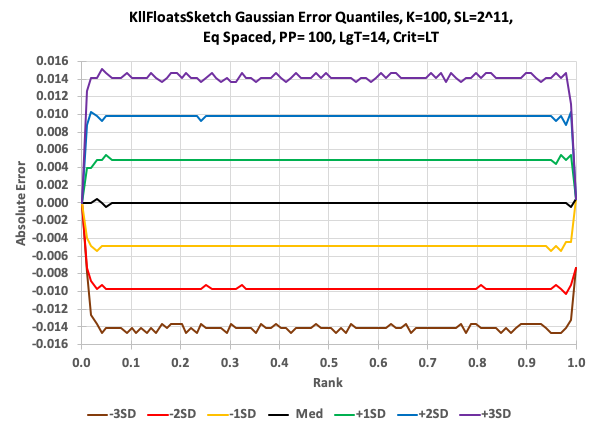
This first plot illustrates the typical error behavior of the KLL sketch (also the quantiles/DoublesSketch). The error is flat for all ranks (0, 1). The green and yellow lines correspond to +/- one RSE at 68% confidence; the blue and red lines, +/- two RSE at 95% confidence; and, the purple and brown lines +/- 3 RSE at 99% confidence. The reason all the curves pinch at 0 and 1.0, is because the sketch knows with certainty that a request for a quantile at rank = 0 is the minimum value of the stream; and a request for a quantiles at rank = 1.0, is the maximum value of the stream. Both of which the sketch tracks.
The next plot is the exact same data and queries fed to the REQ sketch set for High Rank Accuracy (HRA) mode. In this plot, starting at a rank of about 0.3, the contour lines start converging and actually reach zero error at rank 1.0. Therefore the error (the inverse of accuracy) is relative to the requested rank, thus the name of the sketch. This means that the user can perform getQuantile(rank) queries, where rank = .99999 and get accurate results.
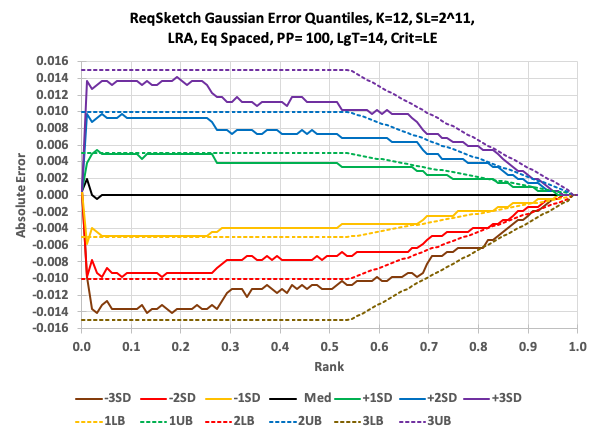
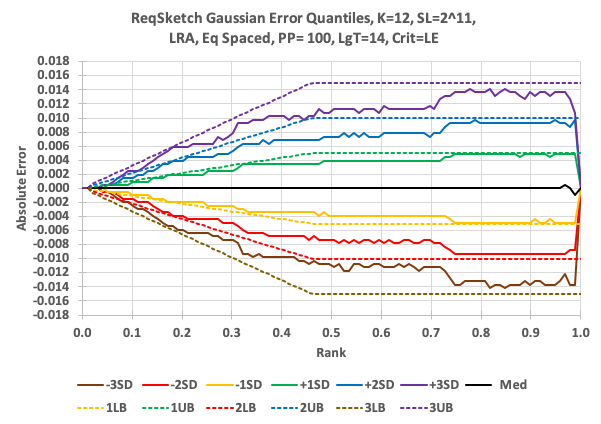
This next plot is also the same data and queries, except the REQ sketch was configured for Low Rank Accuracy (LRA). In this case the user can perform getQuantiles(rank) queries, where rank = .00001 and get accurate results.