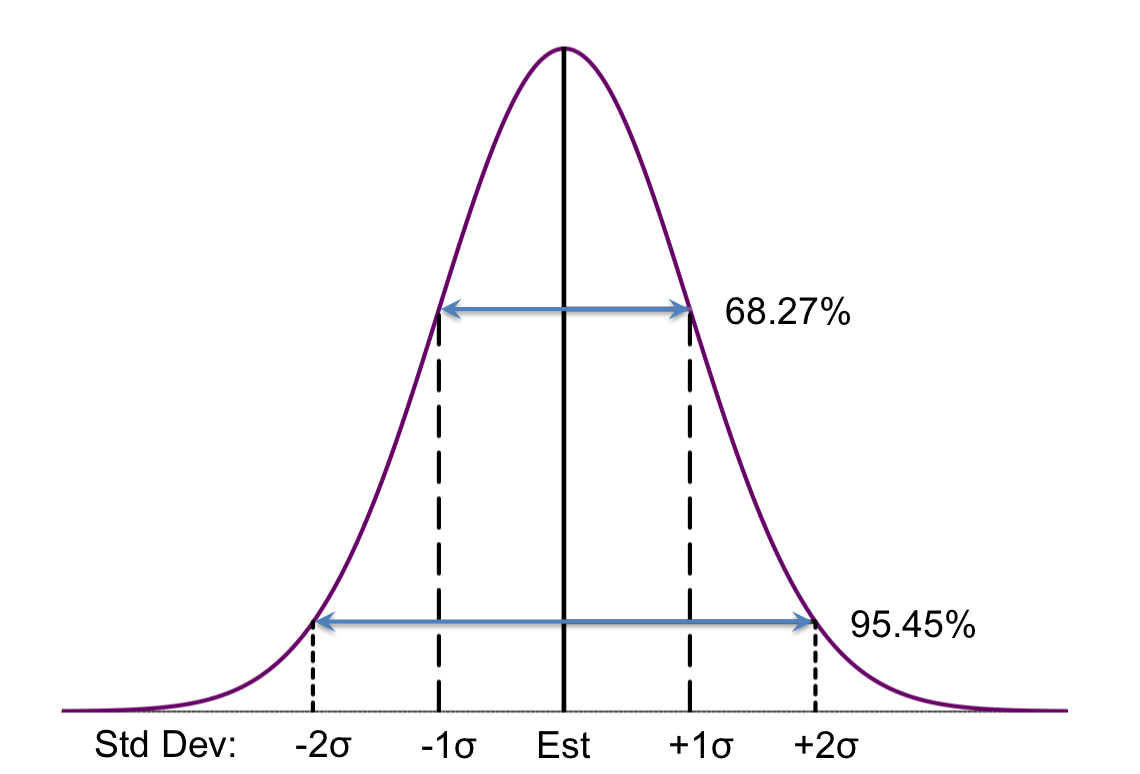
Sketch accuracy is usually measured in terms of Relative Error (RE = Measured/Truth -1). Sketches are stochastic processes and the estimates produced are random variables that have a probability distribution that is close to the familiar Gaussian, which looks like the following.
The sketch estimator algorithm examines the internal state of the sketch and returns an estimate of the mean of the probability distribution that includes the actual value. When the sketch contains more than a hundred or so values, we can assume that the shape is pretty close to Gaussian due to the Central Limit Theorem. It is important to understand that the sketch has no idea what the true value is; it only knows the internal state of the sketch.
From the mathematical theory of these sketches (see Theta Sketch Equations and Theta Sketch Framework) we know:
Dividing the variance by est2 and taking the square root normalizes the error to < 1/√ k - 1 , which is called the Relative Standard Error or RSE. This corresponds to one standard deviation stated as a fraction between zero and one, which can be translated to a percent error. Because k is a constant, the bounds of Relative Error of a sketch is constant.
The area under the curve of the Standard Normal (Gaussian) Distribution is defined to be 1.0. The fractional area between two points on the X-axis is referred to as the confidence level. Thus, the confidence level (the fractional area) between +1 RSE (+1 SD) and -1 RSE (-1 SD) is 68.27%. Similarly, the confidence level between +2 RSE (+2 SD) and -2 RSE (-2 SD) is 95.4%.

