Data Generation
The following table of data was generated as follows:
- Columns 2 through 5 represent HLL and CPC sketches configured with “comparable” parameters.
- HLL4, HLL6, HLL8 represent the TgtHllType configurations of HLL_4, HLL_6, HLL_8.
- The “12” refers to LgK=12 configuration. Note that CPC is configured as LgK=11 because it is comparable to an HLL sketch of LgK=12.
- All measurements are for sketches configured for on-heap, except for the Serialization and Deserialization speeds, where the sketch is configured to “wrap” an off-heap sketch.
- The number of uniques fed to each sketch was 2^20 or 1 Mi unique updates.
- Each Test was run with a large number of trials to reduce the variance in the average. This ranged from 2^16 to 2^20 trials per measurement.
Seven Metrics
The seven metrics are as follows:
- Update Time, Nanoseconds This is the time required to update the sketch with a simple long value in a very tight loop. This is very sensitive to the measurement environment and hardware so consider these values as important only relatvie to each other as they were measured under the same conditions.
- Serialization Time, Nanoseconds Time required to serialize the state of the sketch to a byte array.
- Deserialization Time, Nanoseconds Time required to deserialize the serialized byte array back to a sketch on the Java heap.
- Merge Time, Nanoseconds The time required, per sketch, to merge into the Union operator. These numbers are only useful for comparison in this table because merge times are sensitive to many, many factors.
- Solo Error RSE This is theoretical Relative Standard Error based on the configured size of the sketch and using the most accurate estimator for a single (solo) sketch that is not involved in any merge operations.
- Merge Error RSE This is theoretical Relative Standard Error based on the configured size of the sketch and using the most accurate estimator for a sketch that is a result of a merge operations.
- Size The stored size of the sketch in bytes. This is a function of the specific configuration of the sketch
Raw Data Table and Normalization
| Metric |
HLL4-12wrap |
HLL6-12wrap |
HLL8-12wrap |
CPC-11 |
| Update Time nS |
10.7 |
12.2 |
10.7 |
10.3 |
| Ser Time nS |
472 |
1,011 |
748 |
9,388 |
| Deser Time nS |
150 |
210 |
556 |
11,638 |
| Merge Time nS |
11,545 |
12,627 |
4,399 |
5,459 |
| Solo Error RSE |
0.013008666 |
0.013008666 |
0.013008666 |
0.013008666 |
| Merge Error RSE |
0.016233778 |
0.016233778 |
0.016233778 |
0.015316534 |
| Size Bytes |
2095 |
3113 |
4136 |
1229 |
In order to generate the following radar charts, the data was normalized as follows:
- The relevant maximum values for each row was selected and effectively set to 1.0.
- The other relevant columns in that row were computed as a fractional value between 0 and 1 with respect to the maximum value for that row.
- The relevant columns for the HLL plot are columns 2, 3 and 4.
- The relevant columns for the HLL, CPC plot are columns 2, 3, 4 and 5.
Reading the Radar Charts
- The charts are configured to compare 7 radial dimensions.
- All of the radial vectors are scaled from 0 to 1 as explained above.
- The smaller the number on each of the radials the better is the metric.
The HLL Radar Chart
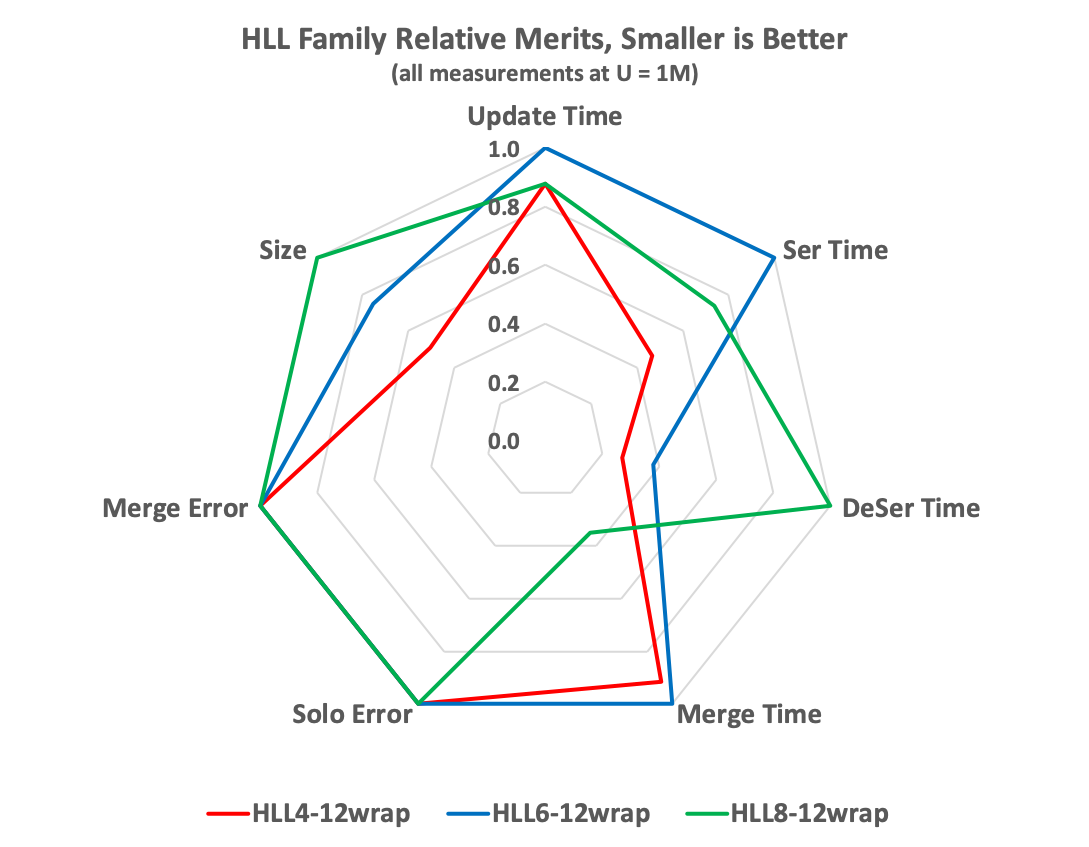
Interpreting the HLL radar chart:
- Error The different TgtHllTypes are isomorphic with respect to accuracy, they are just different internal representations of the same retained data. As you can see the Merge Error and Solo Error are identical for all three types.
- Size The HLL4, which uses 4 bits per slot, is the smallest followed by the HLL6 (6 bits/slot) then the HLL8 (8 bits/slot).
- Update Time The HLL4 and HLL8 are about 12% faster than the HLL6 principally due to the fact that the 6-bit packing has more work to do than the other two.
- Serialization Time The HLL4 is the fastest because has less data to serialize. The HLL6 is the slowest again because of the unpacking logic.
- Deserialization Time In this case the HLL6 and HLL8 reverse positions. The HLL8 is the slowest. However, if you look at the data table you can see that all 3 are pretty fast.
- Merge Time For this metric the HLL8 is clearly the fastest. This is largely do to dedicated optimizations that allow the HLL8 sketch to be very fast on merge.
The HLL and CPC Radar Chart
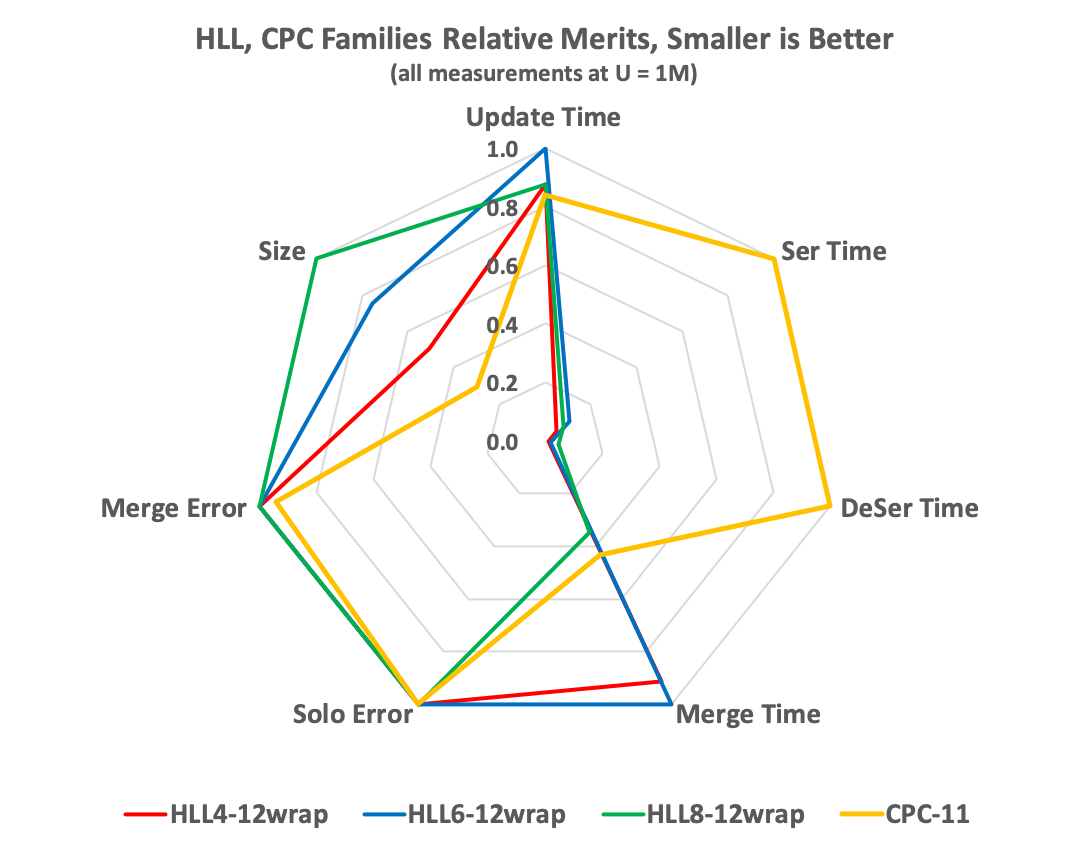
Interpreting the HLL, CPC radar chart:
- Solo Error For a single sketch (no merging) all the sketch types are virtually identical in error.
- Merge Error With Merging the CPC sketch is about 5.7% better than the HLL sketches.
- Size Here the CPC sketch is the big winner. It is 41% smaller than the HLL4 sketch which is the smallest of the 3 HLL sketches.
- SerDe Times Clearly the CPC sketch is the slowest to serialize and deserialize by more than a factor of 10.
- Merge Time Here the CPC is nearly as fast as the HLL8. Note this is measuring just merge time independent of any deserialization.
Conclusion
Depending on what is important in your environment you should choose the sketch that best suits your needs.
Note that all of these tests were performed with the Java implementations of these sketches. The results for C++ or Python may be completely different.

