ReqSketch Accuracy with Adversarial Streams
This set of tests characterize the accuracy (or more precisely the rank error) of the ReqSketch using specifically selected adversarial stream patterns. The goal of this suite of tests is to understand how the rank error of the sketch behaves across all ranks with these specific stream patterns. All of these tests are run with the same sketch configuration except for the choice of the adversarial stream pattern.
The design of these tests is different from the tests for the Random Shuffled Streams in one key aspect, we do not shuffle the input stream for each trial. Here, each test has one pattern and runs multiple trials with exactly the same pattern. The plots then reveal the results of the random process of the sketch itself.
For those that are interested in the actual code that run these tests can examine the following links.
- Code: The code used to generate these characterization studies.
- Config: The human readable and editable configuration file that instructs the above code with the specific properties used to run the test. These configuration properties are different for each of the following plots and summarized below with each plot.
Test Design
- Stream Length (SL): 2^20 = 1,048,576 floats
- Stream Values: Natural numbers, ℕ1, from 1 to SL, expressed as 32-bit floats.
- Y-axis: The absolute error of the sketch getRank(value) method.
- X-axis: The normalized rank [0.0, 1.0]
- Plot Points (PP): 100. Equally spaced points along the X-axis starting at 0 and ending at 1.0.
- Trial:
- The stream is generated according to the chosen adversarial pattern and presented to the sketch.
- Execute estRanks[] = getRanks(trueValues[]) from the sketch where the array of trueValues[] are the 100 equally spaced values along the x-axis that exactly correspond to the above Plot Points. The estRanks[] is the array of the sketch’s estimates of the ranks of the given trueValues.
- Computes the absolute error: estRanks[i] - trueRanks[i] for each Plot Point and submits this error to a corresponding array of standard qantile sketches, with one quantile sketch assigned to each Plot Point.
- Trials:
- 2^12 trials are executed. This produces a distribution of error at each Plot Point held by the error quantile skeches.
- Note: With these tests, since we do not shuffle the stream with each trial, randomization is due to just the internal random process of the sketch itself.
- Extract 7 quantiles from the error quantile sketches at each Plot Point. These error quantiles correspond to the standard normal distribuion at the median, +/- 1SD, +/- 2SD and +/- 3SD, where SD stands for Standard Deviation from the mean.
- Plotting:
- Each of the error quantiles are connected by lines to form contours of the error distribution where the area between the +/- 1SD contours is the size of the 68% confidence interval; between the +/- 2SD coutours is the 95.4% confidence interval; and between the +/- 3SD contours is the 99.7% confidence interval.
- In addition to the error contours. 6 dashed contours (with colors corresponding to the error contours) represent the a priori estimates of the error at each of the +/- standard deviations computed from the sketch’s getRankLowerBound(double, int) and getRankUpperBound(double, int) methods.
Common Configuration for the these tests
- K=50: the sketch sizing & accuracy parameter
- HRA: High Rank Accuracy
- Crit=LT: Comparison criterion: LT = Less-Than
- SL=2^20: StreamLength
- Eq Spaced: Equally spaced Plot Points (PP)
- PP=100: Number of plot points on the x-axis
Results
Plot 1 Adversarial Pattern: Sorted
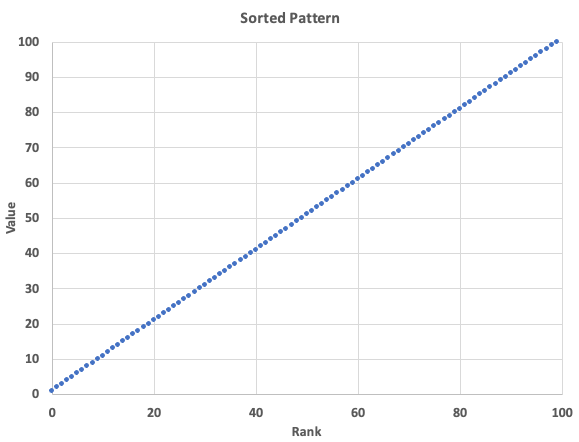
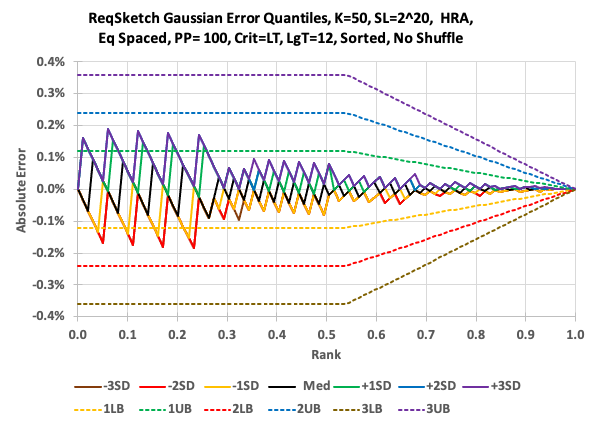
- Run Time: 8:18
- Unique Error Value Count Per Plot Point: Min=2, Max=2
Plot 2 Adversarial Pattern: Reversed
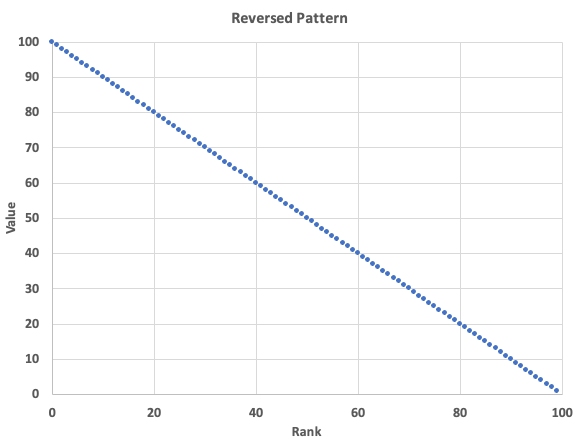
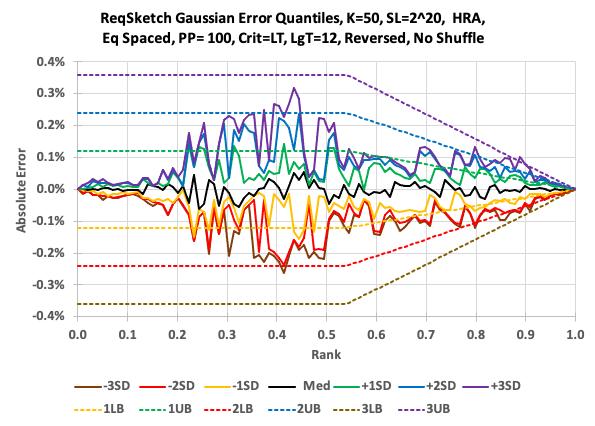
- Run Time: 4:12
- Unique Error Value Count Per Plot Point: Min=8, Max=104
Plot 3 Adversarial Pattern: Random
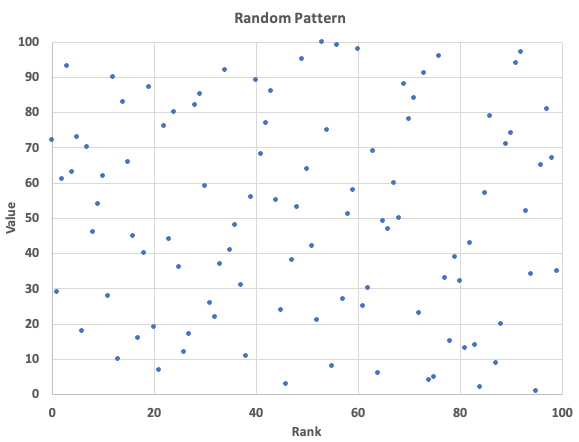
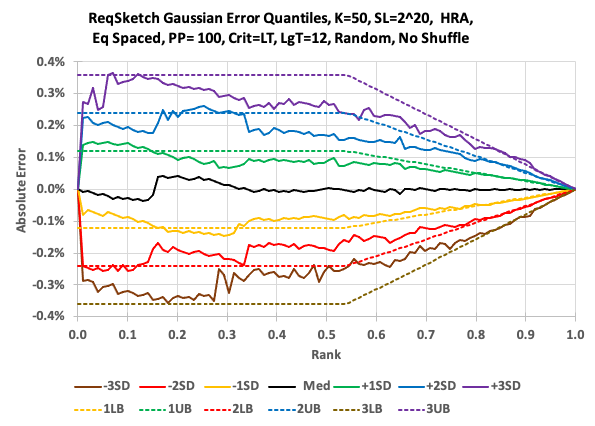
- Run Time: 14:30
- Unique Error Value Count Per Plot Point: Min=61, Max=797
Plot 4 Adversarial Pattern: Zoomin
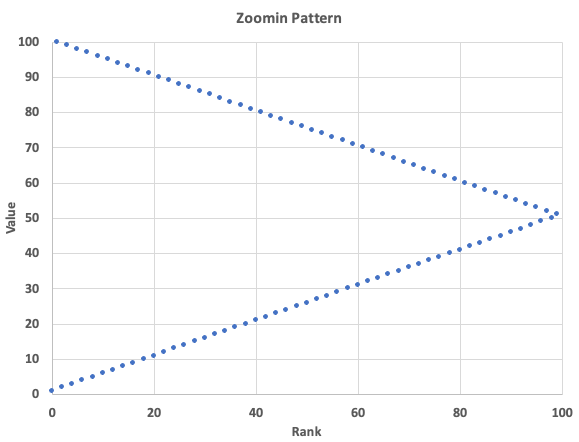
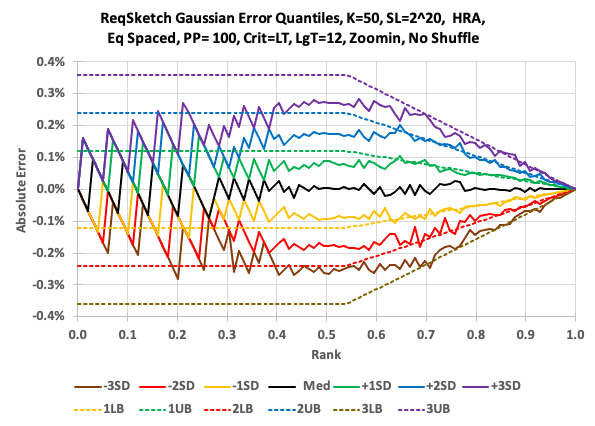
- Run Time: 12:50
- Unique Error Value Count Per Plot Point: Min=2, Max=171
Plot 5 Adversarial Pattern: Zoomout
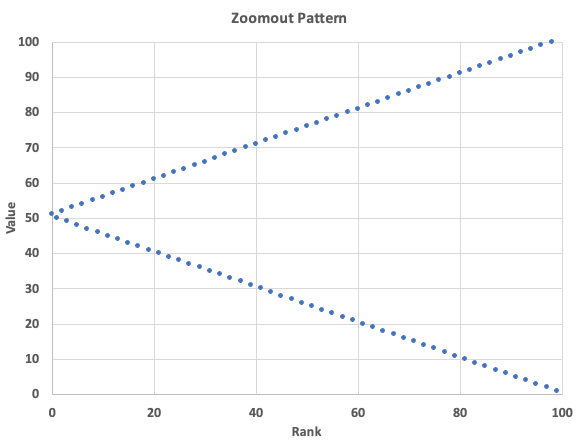
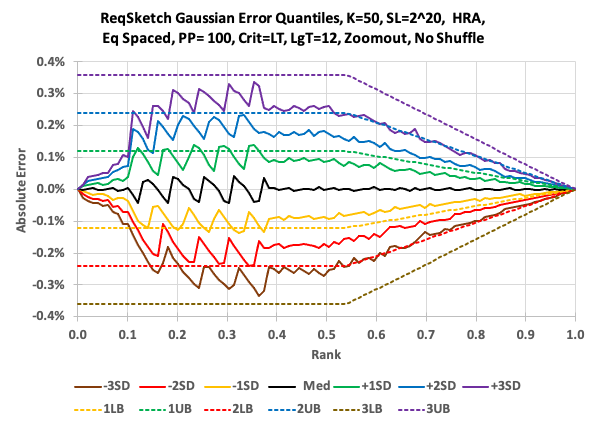
- Run Time: 17:36
- Unique Error Value Count Per Plot Point: Min=24, Max=501
Plot 6 Adversarial Pattern: Sqrt
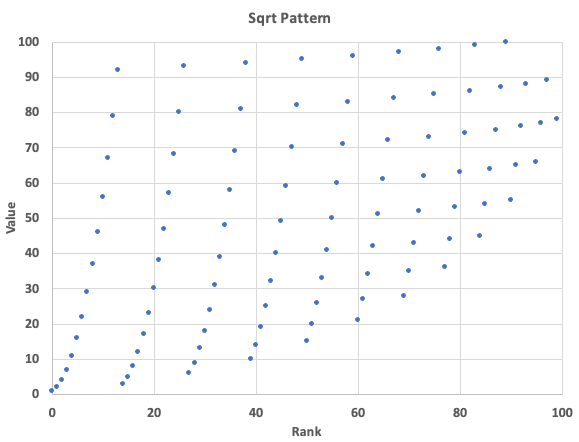
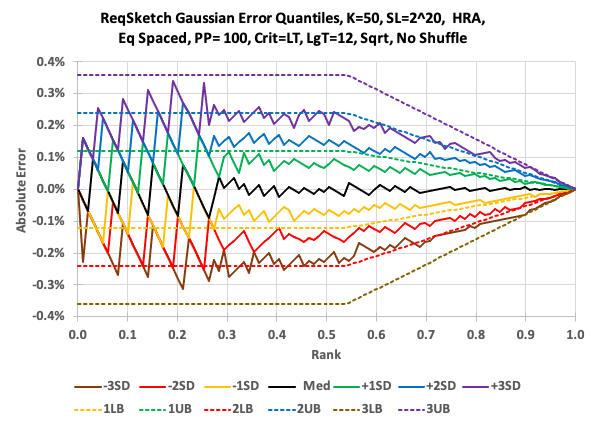
- Run Time: 7:57
- Unique Error Value Count Per Plot Point: Min=2, Max=169
Plot 6 Adversarial Pattern: FlipFlop
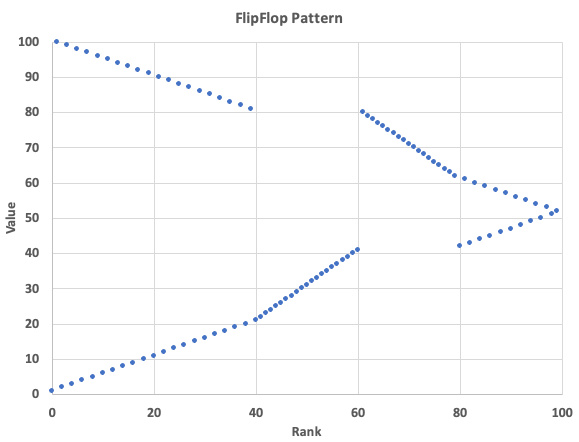
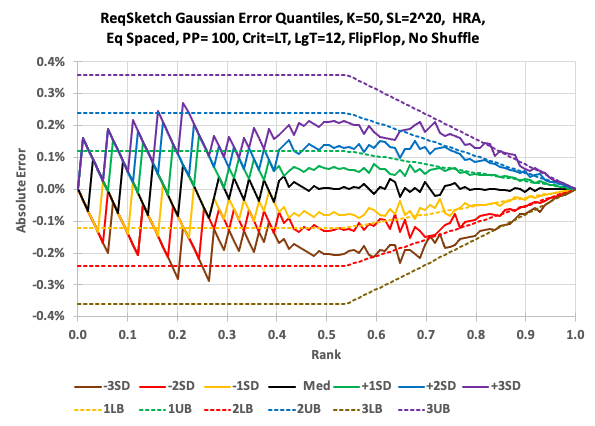
- Run Time: 9:12
- Unique Error Value Count Per Plot Point: Min=2, Max=137
Final Compactor Profile & Size
Because all of these tests are run with the same exact sketch configuration and the same input stream length they all have the same final compactor profile, retained items and Serialization Bytes.
| Lg Wt |
Items |
Nominal Size |
Section Size |
Num Sections |
Num Compactions |
| 0 |
786 |
864 |
18 |
24 |
16288 |
| 1 |
919 |
864 |
18 |
24 |
6755 |
| 2 |
846 |
864 |
18 |
24 |
2979 |
| 3 |
531 |
576 |
24 |
12 |
1308 |
| 4 |
613 |
576 |
24 |
12 |
578 |
| 5 |
529 |
576 |
24 |
12 |
246 |
| 6 |
528 |
576 |
24 |
12 |
106 |
| 7 |
781 |
576 |
24 |
12 |
33 |
| 8 |
621 |
432 |
36 |
6 |
13 |
| 9 |
364 |
432 |
36 |
6 |
4 |
| 10 |
250 |
300 |
50 |
3 |
1 |
| 11 |
135 |
300 |
50 |
3 |
0 |
- Retained Items: 6903
- Serialization Bytes: 28144


