One of the basic concepts that is used in Theta Sketches is that of the Inverse Estimate. Once you become comfortable with it you will acquire a lot of the intuition for how sketches work.
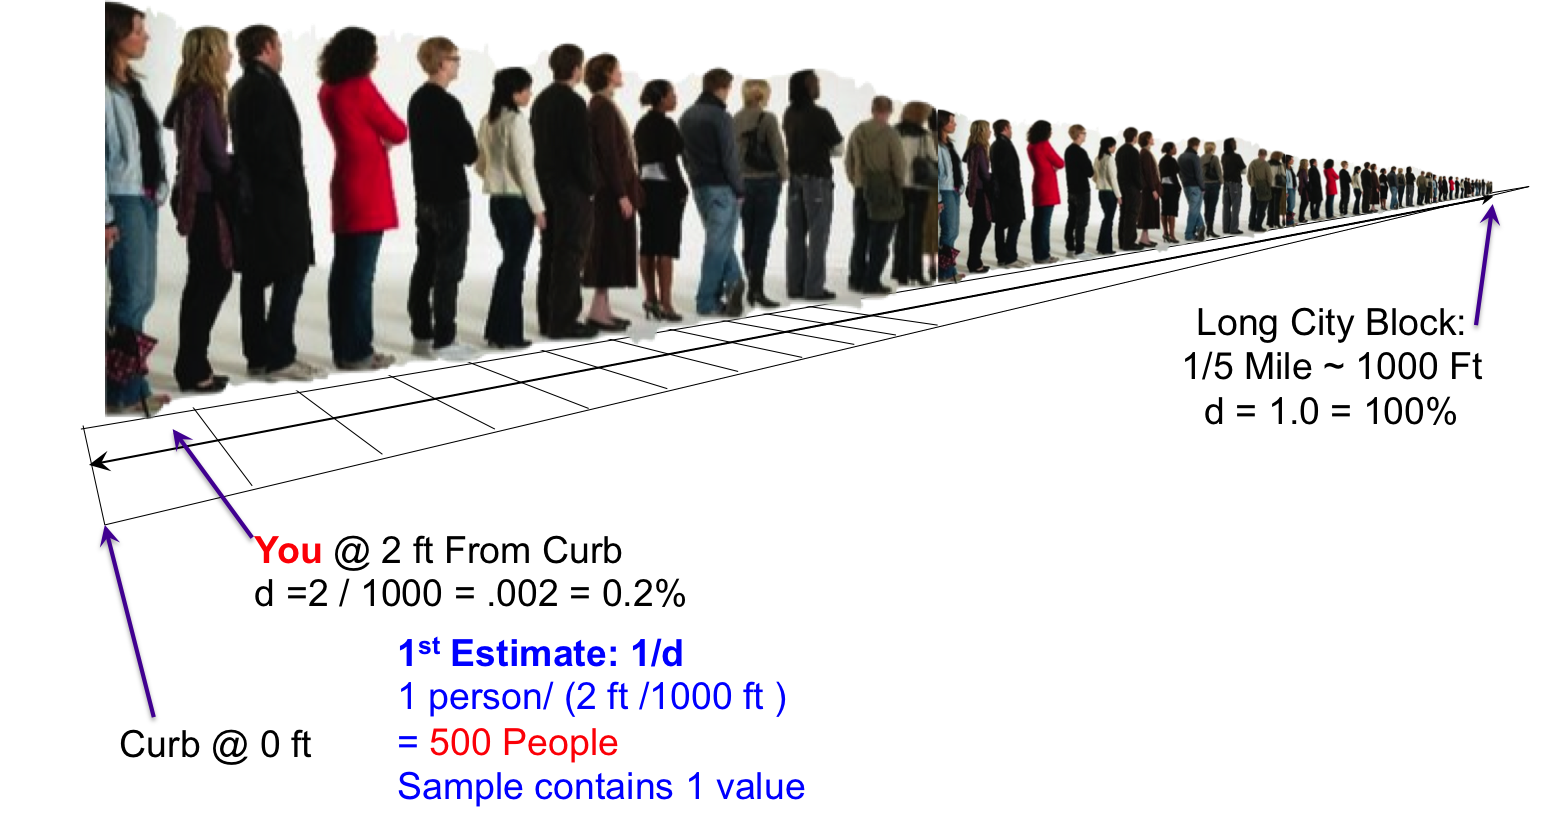
You have just joined the end of a long line for a concert that you are excited to see. That is you, on the very left. The line extends a full city block, which in your city is about one-fifth of a mile or roughly 1000 feet. You would like to know how many people are ahead of you.

The thought process in your head goes something like this for your first estimate:
But what if the block length was different? It might be convenient to normalize the block length to 1.0. The equivalent thought process would be:
This is a rather poor estimate as it has only a sample size of one, you!
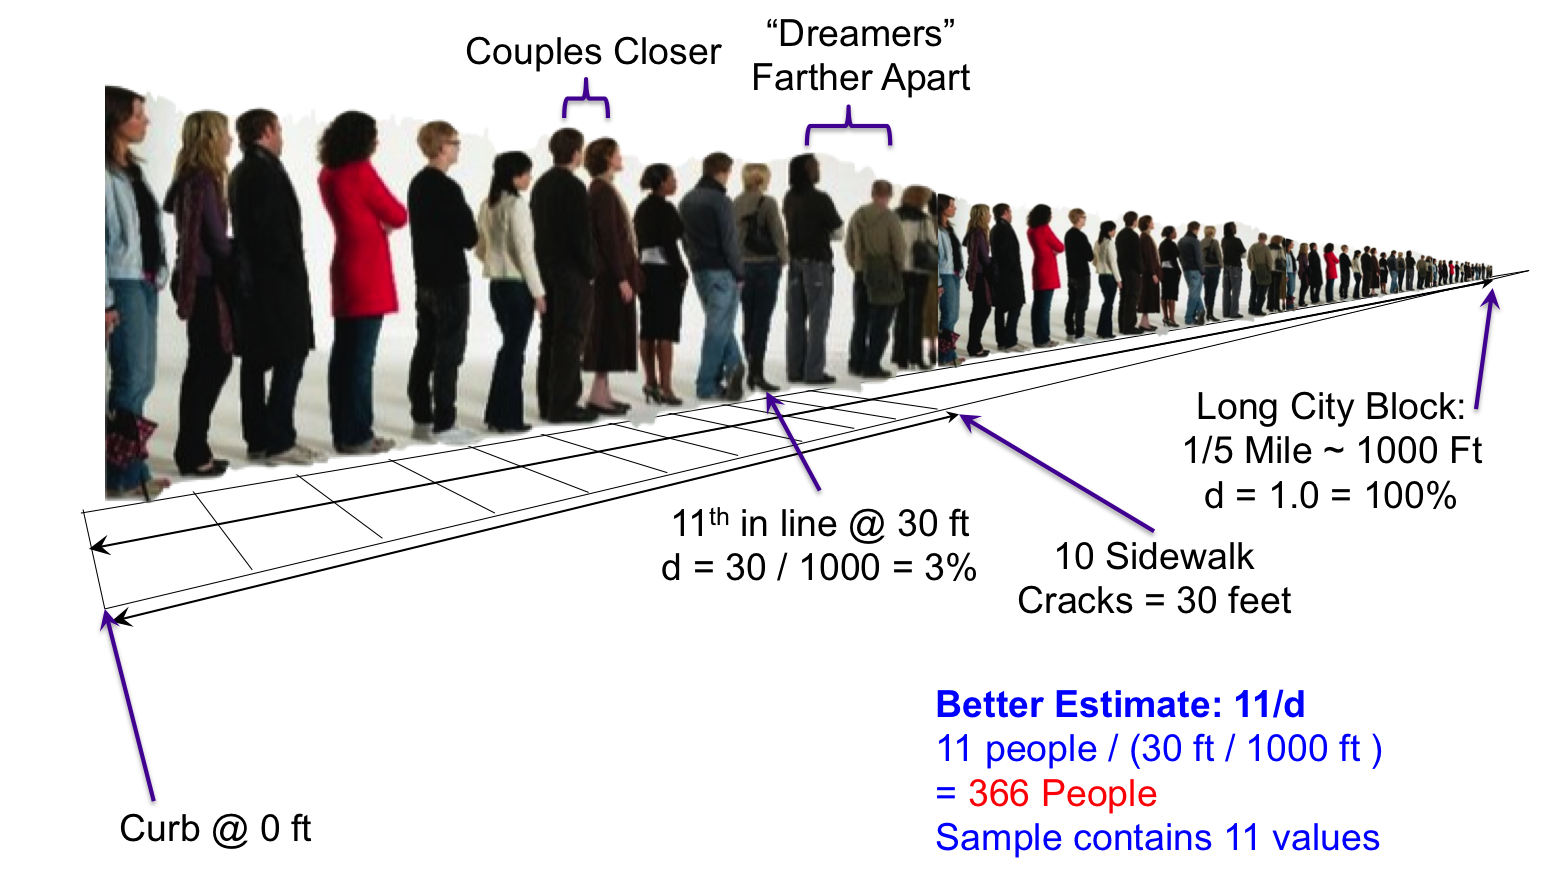
Looking at the people just ahead you realize that not everyone is spaced the same distance apart. Couples tend to stand much closer together, and then there are those “dreamers” that are not paying attention and leave big gaps ahead of them.

A much better estimate could be obtained by averaging the spacing for more than just one person. You can see 10 evenly spaced cracks in the sidewalk ahead, spaced at 3 feet apart, and count 11 people standing in that distance of 30 feet. Now your calculation proceeds as follows:
This is a very different answer and, hopefully, more accurate because you have more samples (11) in your estimate.
You will encounter this inverse estimation equation form many times in this library:
where |S| is the size of some set S, and d is a probability fraction between zero and one.