When customers visit our websites, blogs, or stores it is very useful to understand how engaged they are with us and our products. There are many ways to characterize customer engagement, but one common way is to understand how frequently our customers are returning to visit.
For example, let’s study the following histogram:
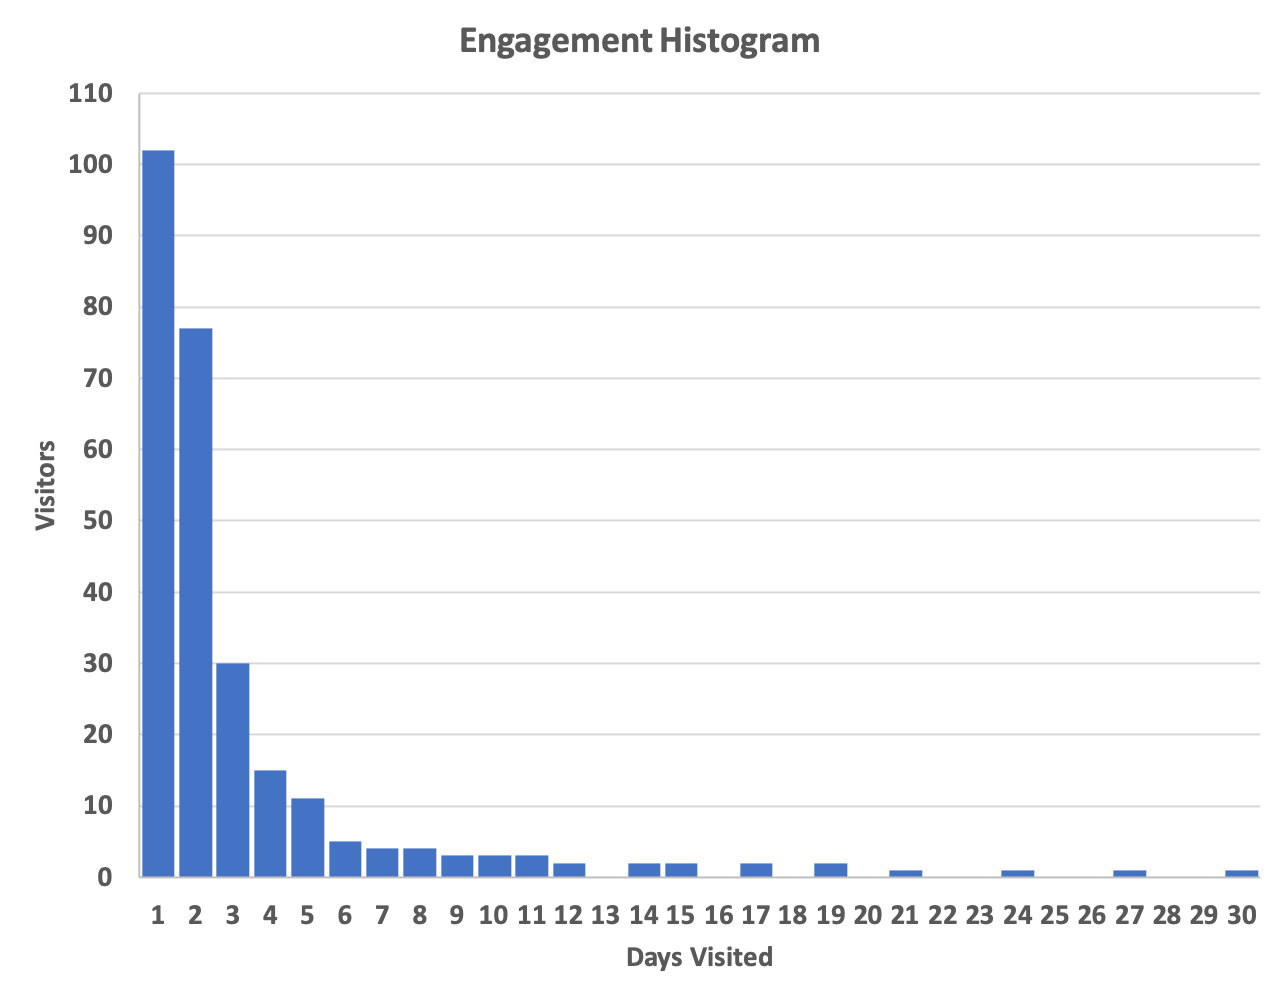
The X-axis is the number of days that a specific customer (identified by some unique ID) visits our site in a 30 day period.
The Y-axis is the number of distinct visitors (customers) that have visited our site X number of times during the 30 day period.
Reading this histogram we can see that about 100 distinct visitors visited our site exactly one day out of the 30 day period. About 11 visitors visited our site on 5 different days of the 30 day period. And, it seems that we have one customer that visited our site every day of the 30 day period! We certainly want to encourage more of these loyal customers.
Different businesses will have different overall time periods of interest and different resolutions for the repeat visit intervals. They can be over years, months, weeks or days, hours or even minutes. It is up to the business to decide what time intervals are of interest to measure. What we show here is clearly a made-up example to convey the concept.
So how do we do this? Especially, how can we do this efficiently, quickly, and suitable for near-real-time results?
Well, we have a sketching app for that!
The input data we need to create the above histogram can be viewed as a stream of tuples, where each tuple as at least two components, a time-stamp and an unique identifier (ID) that is a proxy for a customer or visitor. In real systems, the tuples may have many other attributes, but for our purposes here, we only need these two. The stream of tuples might be a live stream flowing in a network, or data being streamed from storage. It doesn’t matter.
In order for a sketch to work properly it must see all relevant data for a particular day, domain or dimensional coordinates that that particular sketch is assigned to represent. Sketches are mergeable, thus parallelizable, which means that the domain can be partitioned into many substreams feeding separate sketches. At the appropriate time the substream sketches can be merged together into a single sketch to provide a snapshot-in-time analysis of the whole domain.
It is critical to emphasize that the input stream must not be pre-sampled (for example, a 10% random sample) as this will seriously impact the accuracy of any estimates derived from the sketch. It is perfectly fine to pre-filter the input stream to remove robot traffic, for example, which will totally remove that traffic from the analysis.
We want our customers to come back and visit us many times, which will create tuples with duplicate IDs in the stream. This is a good thing, but for this analysis we need to handle duplicate ID’s in two different ways that we separate by two different stages of the analysis.
In our example our fine-grain interval is a day and the overall interval is 30 days. In the first stage we want to process all the tuples for one day in a way that ultimately results in a single sketch for that day. This may mean many sketches operating in parallel to process all the records for one day, but they are ultimately merged down to a single sketch representing all the data for one day.
Since we want to analyze data for 30 days, at the end of Stage 1, we will have 30 sketches representing each of the 30 days.
In this first stage we only want to count visits by any one customer once for a single day, even if a customer visits us multiple times during that day. Thus, we want to ignore any duplicate occurrences of the same ID within the same day.
Once we have our 30 day sketches, we merge all 30 sketches together into one final sketch. This time, however, we want to count the number of duplicates that occur for any single ID across different days. This will give us the number of days that any unique ID appeared across all 30 days.
To help us code our example we will leverage the IntegerSketch package from the library. This package consists of 5 classes, the IntegerSketch and 4 helper classes, all of which extend generic classes of the parent tuple package. Normally, the user/developer would develop these 5 classes to solve a particular analysis problem. These 5 classes can serve as an example of how to create your own Tuple Sketch solutions and we will use them to solve our customer engagement problem.
Please refer to the Tuple Overview section on this website for a quick review of how the Tuple Sketch works.
public class IntegerSketch extends UpdatableSketch<Integer, IntegerSummary> {
The IntegerSketch class extends the generic UpdatableSketch specifying two type parameters, an Integer and an IntegerSummary.
The Integer type specifies the data type that will update the IntegerSummary. The IntegerSummary specifies the structure of the summary field and what rules to use when updating the field with an Integer type.
 public IntegerSketch(final int lgK, final IntegerSummary.Mode mode) {
    super(1 << lgK, ResizeFactor.X8.ordinal(), 1.0F, new IntegerSummaryFactory(mode));
  }
This first constructor takes an integer and a Mode. The integer lgK is a parameter that impacts the maximum size of the sketch object both in memory and when stored, and specifies what the accuracy of the sketch will be. The larger the value the larger the sketch and the more accurate it will be. The “lg” in front of the “K” is a shorthand for Log_base2. This parameter must be an integer beweeen 4 and 26, with 12 being a typical value. With the value 12, there will be up to 2^12 = 4096 possible rows retained by the sketch where each row consists of a key and a summary field. In theory, the summary field can be anything, but for our example it is just a single integer.
We will not be using the second constructor.
  @Override
  public void update(final String key, final Integer value) {
    super.update(key, value);
  }

  @Override
  public void update(final long key, final Integer value) {
    super.update(key, value);
  }
The IntegerSketch has two update methods, one for String keys and an Integer value and the other for long keys and an Integer value. The user system code would call one of these two methods to update the sketch. In our example, we will call the second update method with an integer value representing a user ID and a value of one for the Integer. The key will be hashed and passed to the internal sketching algorithm that will determine if the key-value pair should be retained by the sketch or not. If it is retained, the 2nd parameter will be passed to the IntegerSummary class for handling.
public class IntegerSummary implements UpdatableSummary<Integer> {
  private int value_;
  private final Mode mode_;
  ...
The IntegerSummary class is central to understanding how tuple sketches work in general and how we will configure it for our example.
The IntegerSummary class extends the generic UpdatableSummary specifying one parameter, Integer, the data type that will update this summary. This summary object is very simple. It has one updatable value field of type int and a final Mode field, which tells this summary object the rule to use when updating value.
  /**
   * The aggregation modes for this Summary
   */
  public static enum Mode {

    /**
     * The aggregation mode is the summation function.
     * <p>New retained value = previous retained value + incoming value</p>
     */
    Sum,

    /**
     * The aggregation mode is the minimum function.
     * <p>New retained value = min(previous retained value, incoming value)</p>
     */
    Min,

    /**
     * The aggregation mode is the maximum function.
     * <p>New retained value = max(previous retained value, incoming value)</p>
     */
    Max,

    /**
     * The aggregation mode is always one.
     * <p>New retained value = 1</p>
     */
    AlwaysOne
  }
The Mode enum defines the different rules that can be used when updating the summary. In this case we have four rules: Sum, Min, Max, and AlwaysOne. For our example, we will only use Sum and AlwaysOne. There is only one public constructor which specifies the mode that we wish to use. The getValue() method allows us to extract the value of the summary when the sketching is done.
  @Override
  public void update(final Integer value) {
    switch (mode_) {
    case Sum:
      value_ += value;
      break;
    case Min:
      if (value < value_) { value_ = value; }
      break;
    case Max:
      if (value > value_) { value_ = value; }
      break;
    case AlwaysOne:
      value_ = 1;
      break;
    }
  }
This method is called by the sketch algorithms to update the summary with the value provided by the IntegerSketch update method described above. This is the code that implements the aggregation rules specified by the Mode.
This class allows us to define different updating rules for two different set operations: Union and Intersection. In this context “Union” is synonymous with “merge”. In our example we will only use the Union set operation.
It is important to note here that this set operations class also uses the mode updating logic of the IntegerSummary class. These updating modes can be different than the mode used when the IntegerSummary is used with the IntegerSketch class.
This class is only called by the underlying sketch code when a new key-value pair needs to be retained by the sketch and a new empty Summary needs to be associated with the new key, and the new summary may need to be updated by the incoming value.
This class is only called by the underlying sketch code when deserializing a sketch and its summaries from a stored image. We will not be using this class in our example.
Note 1: the version in the GitHub master is more up-to-date than the version of this class in the 1.1.0-incubating release. This tutorial references the code in master.
Note 2: You can run the following computeEngagementHistogram() method as a test, but in order to see the output you will need to un-comment the printf(…) statement at the very end of the class.
  @Test
  public void computeEngagementHistogram() {
    int lgK = 8; //Using a larger sketch >= 9 will produce exact results for this little example
    int K = 1 << lgK;
    int days = 30;
    int v = 0;
    IntegerSketch[] skArr = new IntegerSketch[days];
    for (int i = 0; i < days; i++) {
      skArr[i] = new IntegerSketch(lgK, AlwaysOne);
    }
    for (int i = 0; i <= days; i++) { //31 generating indices for symmetry
      int numIds = numIDs(days, i);
      int numDays = numDays(days, i);
      int myV = v++;
      for (int d = 0; d < numDays; d++) {
        for (int id = 0; id < numIds; id++) {
          skArr[d].update(myV + id, 1);
        }
      }
      v += numIds;
    }
    unionOps(K, Sum, skArr);
  }
This little engagement test uses a power-law distribution of number of days visited versus the number of visitors in order to model what actual data might look like. It is not essential to understand how the data is generated, but if you are curious it will be discussed at the end.
In lines 7 - 10, we create a simple array of 30 sketches for the 30 days. Note that we set the update mode to AlwaysOne. (Because this little test does not generate any duplicates in the first stage, the mode Sum would also work.)
The triple-nested for-loops update the 30 sketches using a pair of parametric generating functions discussed later. Line 22 passes the array of sketches to the unionOps(…) method, which will output the results.
  private static void unionOps(int K, IntegerSummary.Mode mode, IntegerSketch ... sketches) {
    IntegerSummarySetOperations setOps = new IntegerSummarySetOperations(mode, mode);
    Union<IntegerSummary> union = new Union<>(K, setOps);
    int len = sketches.length;

    for (IntegerSketch isk : sketches) {
      union.update(isk);
    }
    CompactSketch<IntegerSummary> result = union.getResult();
    SketchIterator<IntegerSummary> itr = result.iterator();

    int[] numDaysArr = new int[len + 1]; //zero index is ignored

    while (itr.next()) {
      //For each unique visitor from the result sketch, get the # days visited
      int numDaysVisited = itr.getSummary().getValue();
      //increment the number of visitors that visited numDays
      numDaysArr[numDaysVisited]++; //values range from 1 to 30
    }

    println("\nEngagement Histogram:");
    println("Number of Unique Visitors by Number of Days Visited");
    printf("%12s%12s%12s%12s\n","Days Visited", "Estimate", "LB", "UB");
    int sumVisits = 0;
    double theta = result.getTheta();
    for (int i = 0; i < numDaysArr.length; i++) {
      int visitorsAtDaysVisited = numDaysArr[i];
      if (visitorsAtDaysVisited == 0) { continue; }
      sumVisits += visitorsAtDaysVisited * i;

      double estVisitorsAtDaysVisited = visitorsAtDaysVisited / theta;
      double lbVisitorsAtDaysVisited = result.getLowerBound(numStdDev, visitorsAtDaysVisited);
      double ubVisitorsAtDaysVisited = result.getUpperBound(numStdDev, visitorsAtDaysVisited);

      printf("%12d%12.0f%12.0f%12.0f\n",
          i, estVisitorsAtDaysVisited, lbVisitorsAtDaysVisited, ubVisitorsAtDaysVisited);
    }

    //The estimate and bounds of the total number of visitors comes directly from the sketch.
    double visitors = result.getEstimate();
    double lbVisitors = result.getLowerBound(numStdDev);
    double ubVisitors = result.getUpperBound(numStdDev);
    printf("\n%12s%12s%12s%12s\n","Totals", "Estimate", "LB", "UB");
    printf("%12s%12.0f%12.0f%12.0f\n", "Visitors", visitors, lbVisitors, ubVisitors);

    //The total number of visits, however, is a scaled metric and takes advantage of the fact that
    //the retained entries in the sketch is a uniform random sample of all unique visitors, and
    //the the rest of the unique users will likely behave in the same way.
    double estVisits = sumVisits / theta;
    double lbVisits = (estVisits * lbVisitors) / visitors;
    double ubVisits = (estVisits * ubVisitors) / visitors;
    printf("%12s%12.0f%12.0f%12.0f\n\n", "Visits", estVisits, lbVisits, ubVisits);
  }
In the unionOps method, line 2 initializes the IntegerSummarySetOperations class with the given mode, which for stage 2 of our example must be Sum. Line 3 creates a new Union class initialized with the setOps class.
In lines 6-8 the union is updated with all of the sketches from the array.
In lines 9-10, the result is obtained from the union as a CompactSketch and a SketchIterator is obtained from the result so we can process all the retained rows of the sketch.
In lines 12-19, we accumulate the frequencies of occurences of rows with the same count value into the numDaysArr.
The remainder of the method is just the mechanics of printing out the results to the console, and computing the error bounds for each row and for the totals. The output should look something like this:
Engagement Histogram:
Number of Unique Visitors by Number of Days Visited
Days Visited    Estimate          LB          UB
           1          98          92         104
           2          80          75          86
           3          32          30          36
           4          16          15          19
           5          10           9          13
           6           5           5           8
           7           4           4           7
           8           4           4           7
           9           3           3           6
          10           2           2           4
          11           3           3           6
          12           2           2           4
          14           2           2           4
          15           2           2           4
          17           2           2           4
          19           2           2           4
          21           1           1           3
          24           1           1           3
          27           1           1           3
          30           1           1           3

      Totals    Estimate          LB          UB
    Visitors         272         263         281
      Visits         917         886         948
This is the data that is plotted as a histogram at the top of this tutorial.
This section is for folks interested in how the data for this example was generated. This is optional reading.
Much of the data we analyze from the Internet has the classical “long-tailed” distribution or a power-law distribution. When frequencies of occurences of some type is plotted on a log-log axis we tend to get a negatively sloping, mostly-straight line. There have been numerous books and papers written about this phenomenon, but it is quite real and any analysis tools used to analyze big data should take this into account.
For this example, it was useful to generate data that at least had some resemblence to what a user might actually experience with their own data.
To plot a straight line on a graph we use the familiar y = mx + b formula from high school, where m is the slope and b is the y-intercept. In our example, we want the line to start at the maximum number of days, d, and have a negative slope so our equation becomes y = -mx + d.
As we noted above, we actually want this to be a straight line on a log-log graph, so each of the variables y, x and d are actually log variables. Now our equation becomes
log y = -m log x + log d.
To transform this into a pair of parametric equations we perform the following operations. First we multiply through by d / log(d) to isolate d by itself on both sides
d log y / log d = -d m log x / log d + d.
Then we insert our parametric variable i, which will vary from zero to d, in the middle:
d log y / log d = i = -d m log x / log d + d.
Solving for both x and y separately gives
y = exp(i/d log d),
x = exp((d-i)/(d m) log d).
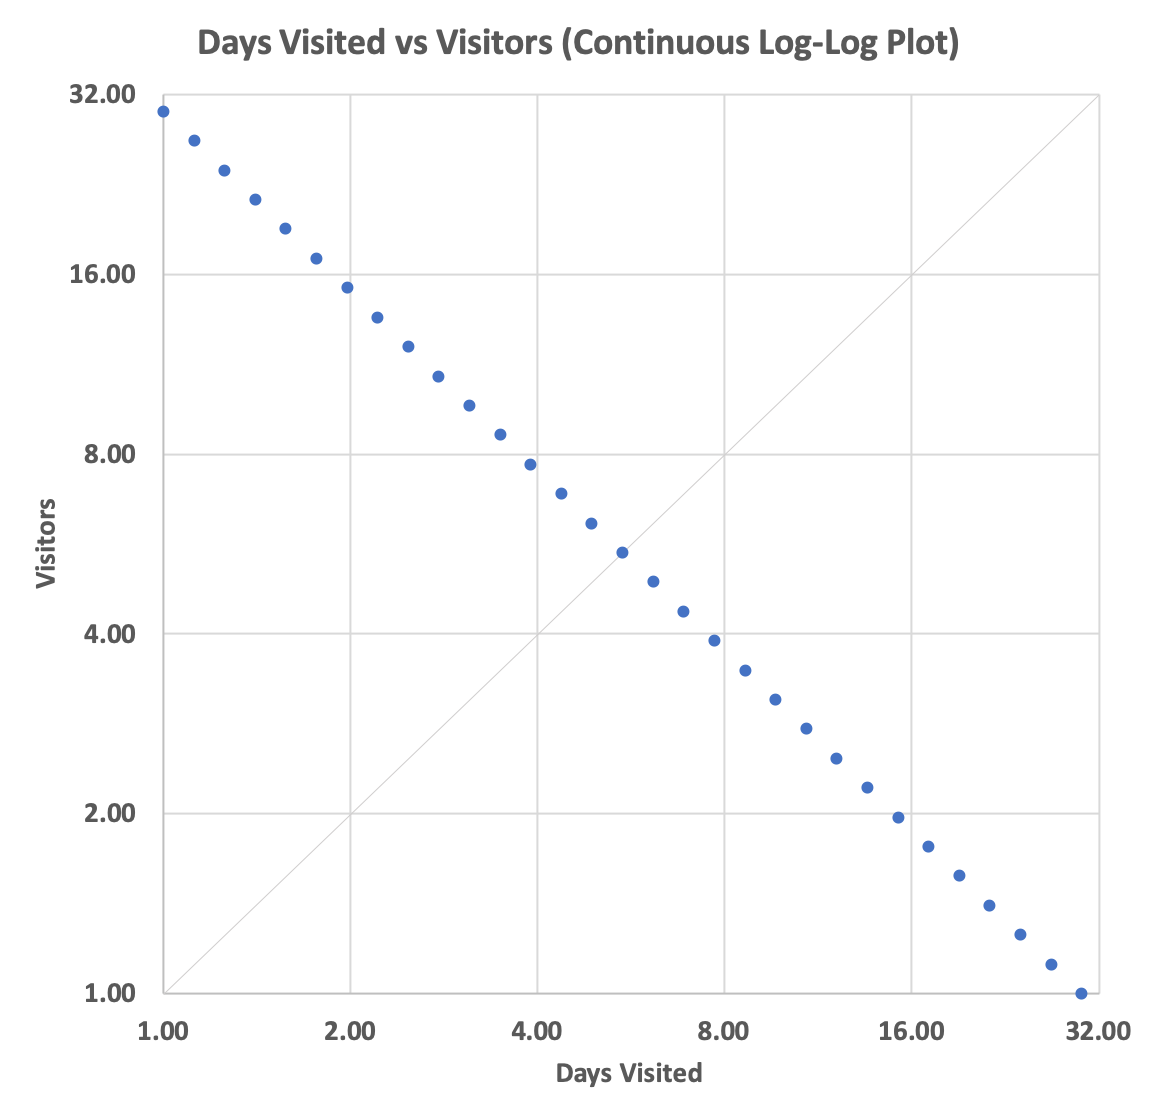
These are continuous functions and when plotted we can see our negative sloping plot (here m = 1) starting at y=30 and ending at x = 30. The parametric variable i varies from 0 to 30, inclusively.
This, of course, results in non-integer coordinates, which is not what we want. Descretizing the equations becomes
y = round(exp(i/d log d)),
x = round(exp((d-i)/(d m) log d)).
This produces
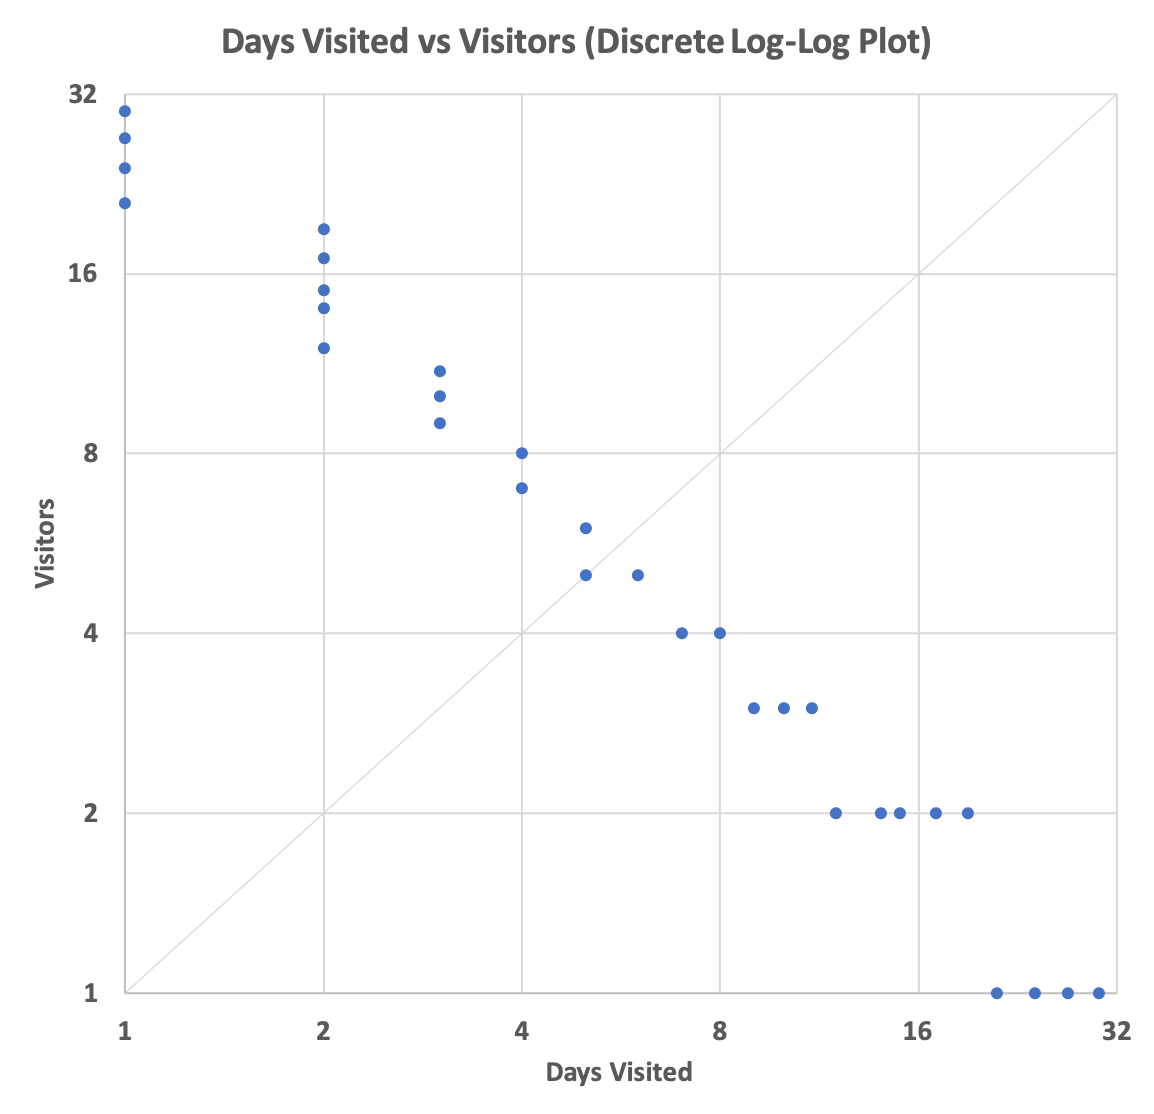
Note that these plots are symmetric about the faint 45 degree line.
The points on this graph represent the parameters for the two inner for loops used to generate the final data fed to the sketches.

