The goal of this article is to compare the accuracy performance of the Moments Sketch to an exact, brute-force computation using actual data extracted from one of our back-end servers.
Please get familiar with the Tutorial for quantiles.
Compare this study with the DataSketches Quantiles StreamA Study with the same input data.
The implementation of this Moments Sketch was based on the July 13, 2018 paper by Edward Gan, Jialin Ding, Kai Sheng Tai, Vatsal Sharan, Peter Bailis of Stanford InfoLab. However, it should be noted that the authors of the paper specifially mention the following caveats:
Unfortunately, real data can be quite ugly as it can be highly skewed and with lots of zeros, nulls, gaps, and sometimes negative values.
The data file used for this evaluation, streamA.txt, is real data extracted from one of our back-end servers. It represents one hour of web-site time-spent data measured in milliseconds. The data in this file has a smooth and well-behaved value distribution with a wide dynamic range. It is a text file and consists of consecutive strings of numeric values separated by a line-feeds. Its size is about 2GB.
In order to measure the accuracy of the Moments Sketch, we need an exact, brute-force analysis of streamA.txt.
The process for creating these comparison standards can be found here.
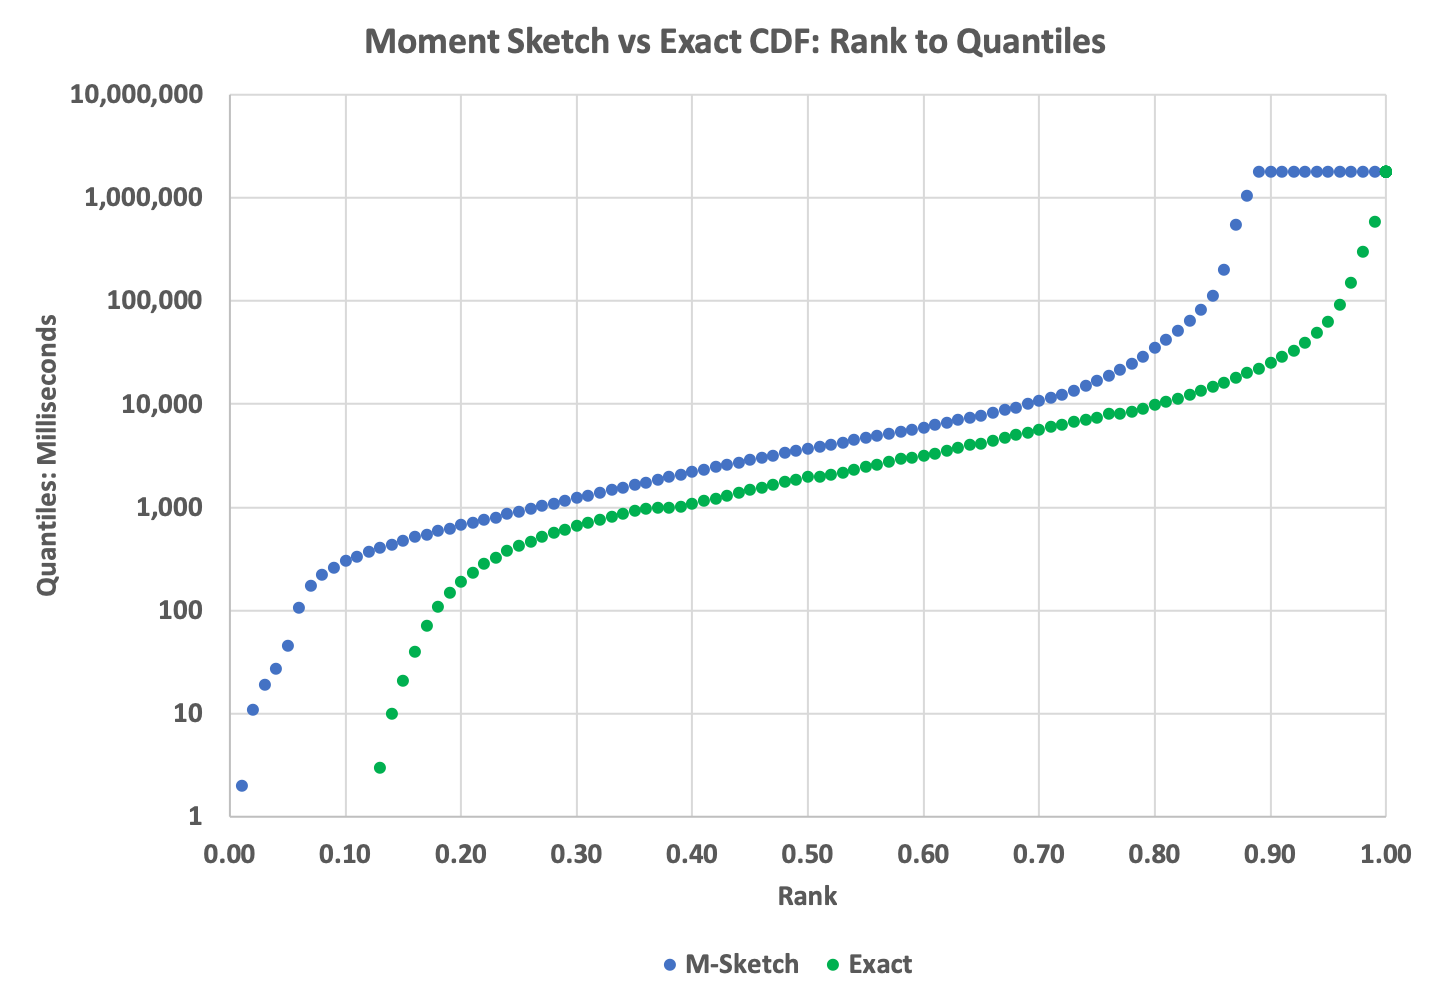
The CDF plot:

The green dots in the above plot represents the Exact cumulative distribution (CDF) of ranks to quantile values. The blue dots represent the values returned from the MomentSketchWrapper getQuantiles(double[]) function.
The plot reveals that the MSketch has improperly shifted the entire distribution by about 12% to the left creating a fixed rank error of at about 12% over the entire range. This is likely due to the zeros that naturally occur in this data. This failure is silent as MSketch does not provide any warning that this kind of distortion might be occurring.
The Msketch does not provide the inverse getRank(v) functionality. This means creating a Histogram or PMF from the Msketch is not simple to do.
Users would be well-advised to not use this tool for serious analysis.
The following are used to create the plots above.
Run the above profilers as a java application and supply the config file as the single argument. The program will check if the data file has been unzipped, and if not it will unzip it for you.